Your CPU is pinned and the site won't load — how do you tell a DDoS attack apart from a compromised server?
Whether a server is being attacked is not a matter of intuition but of evidence: look at the total number of connections and their state distribution first, then at which direction the traffic is coming from, and finally narrow the anomaly down to a single IP or a single interface. Most DDoS incidents can be classified within minutes using four indicators — total connections, connection state distribution, NIC packet rate, and kernel drop counters.
The short answer: a saturated CPU and an unreachable website are symptoms, not a diagnosis. What actually tells you which kind of attack is happening is which state the connections are stuck in, and which direction the traffic is flowing from.
This article helps operators recognise attack patterns and harden their own systems. Attacking or testing someone else's server without authorisation is illegal.
1. First, distinguish "under attack" from "compromised" — the response is the opposite
This step is the one most often skipped, yet it determines the direction of everything that follows. CPU pinned near 100%, the site unreachable, a restart that fixes things for a few minutes before the problem returns — all of these symptoms fit both a live DDoS attack and a server that has been quietly enrolled to mine cryptocurrency. Pick the wrong frame and you burn the most valuable minutes of your response window.
The distinction is straightforward in practice:
-
Is the anomalous traffic inbound or outbound? Use
ss -tanpto inspect the remote addresses. A flood of connections arriving from outside, spread across highly dispersed source IPs, points to an attack. A local process opening large numbers of outbound connections or blasting packets points to a compromised host. -
Look at the process itself. A mining payload usually shows up as an unfamiliar process permanently pinned at high CPU, with a name masquerading as a system component, an executable path outside the system directories, and no valid signature.
-
Check for outbound communication. Being attacked means traffic can't get in; being compromised usually also means traffic goes out — callbacks to a command-and-control address, data being exfiltrated. Both leave traces in the connection list.
The playbooks are also opposites: an attack calls for absorbing and scrubbing, a compromise calls for isolating first and cleaning up second. Do not simply restart, because a reboot wipes the in-memory evidence you need.
2. Layer one: the volume and type of connection states
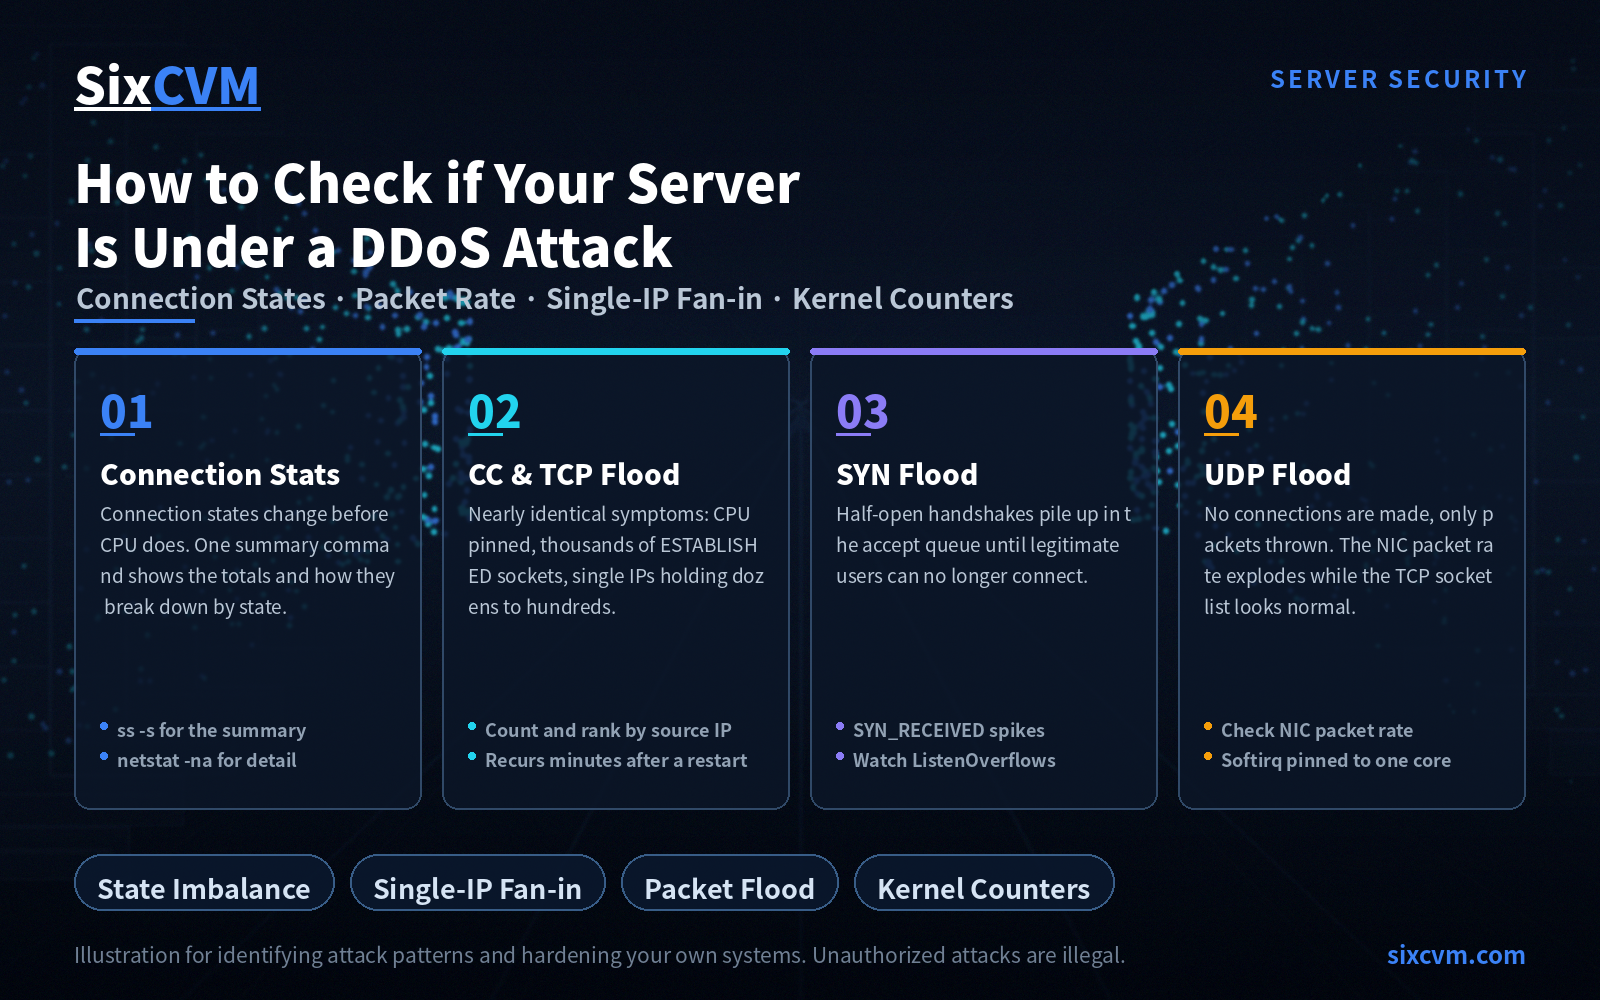
When a server comes under attack, connection states change before CPU does — a saturated CPU is the result. So start with connections.
Get the summary first
ss -s prints the total connection count, the breakdown by state, and kernel buffer usage. It is the fastest single-glance check available.
One practical note:
netstat, which ships with the net-tools package, is no longer installed by default on current distributions, so many fresh systems report "command not found". It has not been withdrawn, butssis both faster and more informative, so prefer it. Install net-tools if you specifically need the older command.
Then aggregate and rank by source IP
The classic netstat -an | grep :80 | sort filters port 80 connections, but it sorts the whole line as text, which tells you nothing useful. What you actually want is a per-source-IP count, ranked. The correct form is:
ss -tan | awk 'NR>1{print $5}' | cut -d: -f1 | sort | uniq -c | sort -rn | head -20
(To use netstat instead, swap ss -tan for netstat -an.)
This does four things: pull the remote address of every connection, strip the port so only the IP remains, count occurrences per IP, and sort descending. The IP at the top of that list is your first suspect.
Check the state distribution
Different attacks leave connections stranded in different states, and that is exactly what makes classification possible:
ss -tan state established | wc -l     # established connections
ss -tan state syn-recv    | wc -l     # half-open connections
-
Abnormally many ESTABLISHED: the connections genuinely completed, meaning requests are reaching the application layer.
-
Abnormally many SYN_RECEIVED: the handshake only half finished, meaning someone deliberately is not completing connections.
Finish with the kernel counters
The kernel has been keeping score the whole time, and its numbers are earlier and more objective than your application logs:
nstat -az | grep -iE 'listen|syn|retrans'
Watch three in particular: TcpExtListenOverflows (accept queue overflows), TcpExtListenDrops (connections dropped while queued), and TCP retransmissions. If these keep climbing, connections are already being squeezed out at the system level — that is not the application being slow, and the two demand completely different fixes.
3. CC attacks and TCP full-connection floods: nearly identical symptoms
From the outside these two leave almost the same fingerprint, and connection states alone cannot separate them:
-
CPU sustained near saturation
-
The site returns
service unavailable, or simply will not load -
A restart restores service for a few minutes, then the problem returns
-
Thousands of ESTABLISHED sockets, with individual IPs holding dozens to hundreds
The real difference lies in the request content, not the connection state:
-
A CC attack targets the endpoints that force the server to do real work — search, login, list pages that join multiple tables. Every request is formally valid, which gives the server no reason to refuse it. The pressure concentrates on application processes (PHP-FPM, Java thread pools) and database connections.
-
A TCP full-connection flood weaponises the connection count itself. A single host can only hold so many concurrent connections, and once that ceiling is reached, legitimate users simply cannot get a slot. The pressure concentrates on connection table size and memory.
How to tell them apart: compare the anomalous IPs against your access log. If those IPs keep hitting the same expensive endpoints, it is CC. If they open connections and then request almost nothing, it is a connection flood.
4. SYN floods: half a handshake, then silence
A SYN flood exploits the mechanics of the TCP handshake. A normal handshake runs client SYN → server SYN-ACK → client ACK, and after sending the SYN-ACK the server parks that connection in the half-open queue awaiting confirmation. The attacker sends only the first step and then disappears, leaving the server to wait until the queue fills up.
The signature is easy to recognise:
-
CPU usage climbs
-
SYN_RECEIVEDcounts spike far above normal -
Once the half-open queue fills, legitimate connection attempts are dropped outright, which users experience as a site that works intermittently
Confirmation commands:
ss -tan state syn-recv | wc -l
nstat -az | grep -E 'ListenOverflows|ListenDrops'
Kernel parameters are the first gate here; the application layer cannot help:
net.ipv4.tcp_syncookies = 1          # use SYN cookies when the backlog is full
net.ipv4.tcp_max_syn_backlog = 8192  # enlarge the half-open queue
net.ipv4.tcp_synack_retries = 2      # retry SYN-ACK less, recycle half-opens faster
One caveat: SYN cookies are an emergency measure, not a permanent setting. They slightly degrade a small number of legitimate connections, so enabling them when a SYN flood is confirmed — and turning them back off afterwards — is the right approach.
5. UDP floods: TCP looks perfect while the NIC is on fire
A UDP flood is unmistakable for one reason — it never establishes a connection at all. So when you check ss or netstat, the TCP side looks spotless while the server is already too slow to work on. That contrast between a quiet connection list and a burning data plane is the best identifier you have.
Its symptoms:
-
The NIC packet rate per second explodes (note: packets per second, not bandwidth — with small packets, bandwidth may still look low)
-
TCP connection state is entirely normal
-
No obviously rogue process at the application layer
Confirmation commands:
cat /proc/net/dev          # cumulative counters; sample twice a few seconds apart
sar -n DEV 1 5             # per-second packet rate
nstat -az | grep -i udp    # UDP counters
Then look at direction and shape of the packets. Small inbound packets spread across many destination ports usually indicate a pure link-saturating volume attack. A single targeted business port suggests a directed attack against one service.
There is also a very common misdiagnosis worth flagging: softirq load concentrated on a single CPU core. On a multi-core box, if one core handles all packet reception, that core can saturate and start dropping packets even though overall CPU utilisation looks fine. mpstat -P ALL 1 and cat /proc/softirqs will show it.
6. Quick reference: four attack types at a glance
|
Attack type |
Obvious surface symptom |
Connection state |
Other key indicator |
|---|---|---|---|
|
CC attack |
CPU saturated, HTTP 503, brief recovery after restart |
Many ESTABLISHED, single IPs holding dozens to hundreds |
The same expensive endpoints requested repeatedly in the access log |
|
TCP full-connection flood |
Memory and connection count maxed out |
Many ESTABLISHED |
Anomalous IPs open connections but request almost nothing |
|
SYN flood |
Site works intermittently |
Many SYN_RECEIVED |
ListenOverflows climbing steadily |
|
UDP flood |
Server sluggish while the TCP connection list looks normal |
Normal |
NIC packet rate explodes; softirq pinned to one core |
7. What order should you investigate in?
Get the order wrong and you waste time on irrelevant layers. Four steps:
-
Start with the connection summary (
ss -s) — is the total abnormal, and which state dominates? -
Aggregate and rank by source IP — the top few IPs are your most direct lead.
-
Then check traffic direction — if connections look normal but the server is stalling, switch immediately to NIC packet rate and softirq distribution to test for a UDP or small-packet attack.
-
Finally, reconcile with the logs — match anomalous IPs against the access log to separate CC from connection floods, and rule out traffic generated locally by an already-compromised host.
8. FAQ
Q1: netstat says command not found — has something gone wrong with my server?No. Current Linux distributions no longer ship net-tools by default. Use ss instead; it is more capable. Install net-tools if you specifically want the older command back.
Q2: Does high CPU usage always mean I am being attacked?No. A saturated CPU can equally come from a mining trojan, an aggressive crawler, a runaway loop in your own code, or a legitimate traffic peak. The key question is where the anomaly originates: external requests piling in means an attack; a local process consuming the CPU points toward a compromise.
Q3: Why does a restart only help for a few minutes?Because restarting does not change the fact that the attack is still running. As soon as the traffic resumes, connections refill. A restart clears the connection table at that moment — it is housekeeping, not a fix.
Q4: How do I tell DDoS and CC apart?A useful rule of thumb: volume-based DDoS (SYN, UDP, TCP floods) shows up in the connection table, NIC packet counters and memory. CC shows up in application processes and database connections, and can only be confirmed by reading the access log. The first bottleneck is at the system layer; the second at the application layer.
Q5: If I can diagnose an attack myself, can I also withstand one?Diagnosis tells you what is happening; mitigation depends on your link and bandwidth. Kernel tuning and rate limiting buy time at the single-host level. Genuinely absorbing a large volumetric attack requires upstream scrubbing capacity and substantial ingress bandwidth — that is data-centre infrastructure, not a server setting.
About SixCVM
SixCVM is a cloud server provider built for cross-border businesses and latency-sensitive workloads, operating six core nodes across Hong Kong, Japan, the United States, Korea, Singapore and Vietnam on CN2 GIA and BGP-optimised routes, with Hong Kong latency as low as 10 ms. Its product range covers cloud servers (VPS), GPU servers (NVIDIA A100 / H100 / RTX series), dedicated servers, bare-metal servers and domain registration, all with NVMe SSD storage, minute-level provisioning, elastic scaling, snapshot backups and load balancing.
For the DDoS risks discussed in this article, SixCVM provides baseline network-layer protection and lets you scale bandwidth and compute elastically during traffic peaks so a single instance's capacity never becomes a single point of failure. Load balancing spreads requests across multiple instances, raising the practical ceiling of your application. The bundled domain registration service includes full DNS management, making it easier to consolidate resolution entry points and coordinate traffic handling with upstream protection. Snapshot backups and rapid reinstalls let you return to a clean state quickly after a compromise. Together with a 99.9% SLA and 24×7 technical support, that adds another layer of protection for business continuity.
This article helps users recognise attack patterns and harden their own systems. Attacking or testing any server you do not own is illegal.
Related reading: browse the full SixCVM Server Security Center for guides covering protection, detection and incident response.